Configuring Prometheus
Healthchecks supports exporting metrics and check statuses to Prometheus, for use with Grafana.
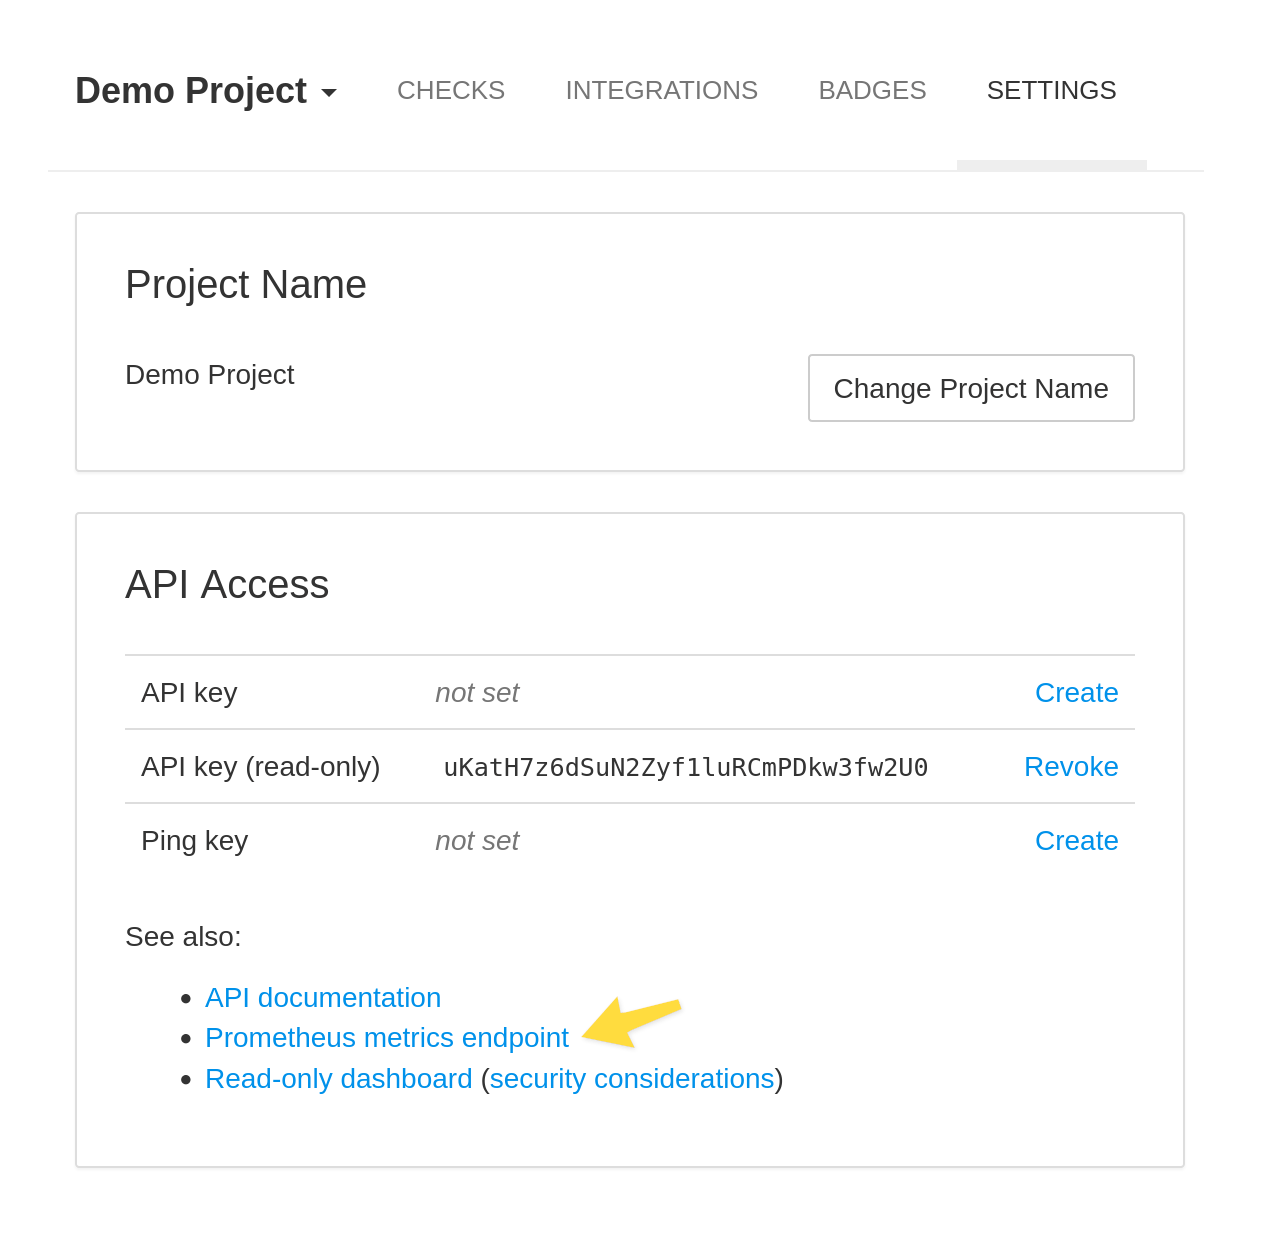
You can generate the metrics export endpoint by going to your project settings and creating a read-only API key. You will then see the link to the Prometheus endpoint:
Update the prometheus.yml
You can copy the Prometheus endpoint URL and add it to the Prometheus configuration:
  - job_name: "healthchecks"
    scrape_interval: 60s
    scheme: https
    metrics_path: /projects/45sd78-eeee-dddd-8888-b25a9887ecfd/metrics/NXyGzks4s8xcF1J-wzoaioyoqXIANGD0
    static_configs:
      - targets: ["hc.monitoring.cuttlefish.com"]
Notice how we split up the URL and paste in the scheme, domain, and path separately.
Reload Prometheus, and your changes should be live, coming in under the hc_ prefix.